
The Site That Never Enrolled: What Clinical Operations Gets Wrong About Early Signals
*Dynamic optimization for clinical operations leaders — the case for acting before certainty arrives*


We monitor what is easy to track. Not what predicts failure.
The industry built dashboards around milestones.
The signals were in the data weeks before the milestone was missed.
The problem is timing, not data
Most clinical operations leaders I have worked with are not short on information. They have site activation trackers, enrollment velocity dashboards, monitoring visit reports, and query resolution metrics. What they are short on is a principled approach to deciding when a signal in that data is worth acting on.
This is not a criticism. It reflects how clinical operations has been taught and evaluated. The dominant framework is milestone-based: a site is “on track” until a milestone is missed, at which point it is “at risk,” at which point remediation begins. The system is legible, auditable, and defensible. It is also consistently late.
The average activated site that ultimately fails to enroll a single patient in a Phase 3 trial shows observable patterns of delay — slow activation completion, intermittent response to startup queries, screen failure rates in early windows that exceed the site-level forecast — within the first eight to twelve weeks of activity. Traditional operations management catches the same site as a non-performer at ten to fourteen months. The gap between “the signal was there” and “the decision was made” is where late-stage programs lose six months of timeline they cannot recover.
Dynamic optimization is a framework for closing that gap.
What Bayesian monitoring looks like in practice
The word “Bayesian” sometimes triggers discomfort in operations teams, which is understandable. The underlying mathematics can sound abstract in a context where the daily reality is protocol deviations, site coordinator turnover, and sponsors asking for enrollment projections every two weeks.
The practical translation is straightforward: instead of asking “has this site failed?” — a question you can only answer in retrospect — you ask “what is the current probability this site will fail, given everything observed so far?” You answer that question monthly, from the moment of activation, and you have pre-specified decision rules for what each probability level triggers.
In a simulation framework I built for a Phase 3 Sjögren’s Disease program, I modeled site performance across a 54-site portfolio using monthly Bayesian updating. The inputs were routine: time from activation to first screened patient, screen failure rate in weeks 1-8, number of protocol queries opened and closed within 30 days, site coordinator contact responsiveness. None of these required special data collection — they were already being tracked. What changed was how they were interpreted.
The model updated a posterior probability of “structural non-performance” — defined as zero enrolled patients at month six — for each site, monthly, from activation. By month three, 80 percent of the eventual non-performers had already crossed the 80 percent confidence threshold. By month four, the figure was 90 percent.
Traditional management caught the same non-performers at month ten to twelve. The clinical team that implemented the Bayesian monitoring protocol and built pre-specified contingency escalation at the 80 percent threshold recovered a five-month enrollment timeline. At $40-80M per month of patent-protected lifecycle value, the financial return on that methodological shift was in the range of $200-400M.
The cost of implementing the monitoring framework: approximately $1.68M in incremental CRO and data management time.
The arithmetic is not complicated. The harder part is building the organizational willingness to act on a probabilistic signal at 80 percent confidence rather than waiting for the certainty that arrives at month twelve.
Why operations teams wait — and what that costs
There is a logic to the current approach that is worth taking seriously before arguing against it.
Site performance remediation is expensive, relationship-sensitive, and sometimes counterproductive. Escalating to a PI who has been activated for twelve weeks and has not yet enrolled sends a message that can permanently damage the sponsor-investigator relationship. Cutting a site that eventually would have enrolled — but slowly — adds contingency activation costs without recovering the timeline. False positives in early performance monitoring create noise that erodes the credibility of the monitoring system.
These concerns are real. They are also largely soluble.
The false-positive problem is addressed by calibrating confidence thresholds to the actual cost of each action tier. An 80 percent threshold does not trigger site removal — it triggers an enhanced support protocol and a structured conversation with the PI about barriers to enrollment. A 90 percent threshold, sustained over two monthly updates, triggers a formal contingency activation decision. The escalation protocol is designed for the uncertainty inherent in early data, not against it.
The relationship concern is addressed by framing. “We are flagging early indicators and deploying additional support” reads differently to an investigator than “you are underperforming and we are considering action.” The clinical operations team that leads with proactive support — additional coordinator resources, patient recruitment assistance, protocol clarification — is perceived as responsive, not punitive. The same data, deployed with a different communication posture, produces a different site response.
The core issue is organizational. Milestone-based management protects the operations team from second-guessing. If you act on a probabilistic signal at month three and you are wrong, you have made a decision without a defensible trigger. If you wait until month twelve and act after the milestone is missed, the trigger is auditable and the decision is easy to explain.
This is understandable as a personal risk management strategy. It is not optimal for the trial, the sponsor, or ultimately for the clinical operations function’s own strategic value.
Redesigning the Clinical Operations Plan
The structural move that makes dynamic optimization practical is building it into the Clinical Operations Plan before the trial starts, not retrofitting it after things go wrong.
A COP that supports dynamic optimization includes: a formal site risk stratification model at activation, with documented priors for each risk tier; monthly Bayesian performance updates from activation through first enrollment; tiered escalation criteria with pre-specified confidence thresholds and corresponding action protocols; a pre-identified contingency site list with estimated activation timelines, agreed in advance with the sponsor; and decision rights clearly allocated — which calls can be made at the CRO/operations level, which require sponsor escalation, and what the expected response timeline is.
None of this is especially complicated. Most of the analytical infrastructure already exists within the CRO or sponsor data systems. What changes is the decision architecture around the data: who reviews it, how frequently, what probability threshold triggers what action, and who has authority to act without waiting for a steering committee review.
The clinical operations teams that have implemented this have reported something worth noting: the monitoring meetings become shorter. When the decision criteria are pre-specified and the probability updating is automated, the monthly site review becomes a focused triage rather than a wide-open discussion. The team spends less time debating whether a site is underperforming and more time executing the response that was already agreed.
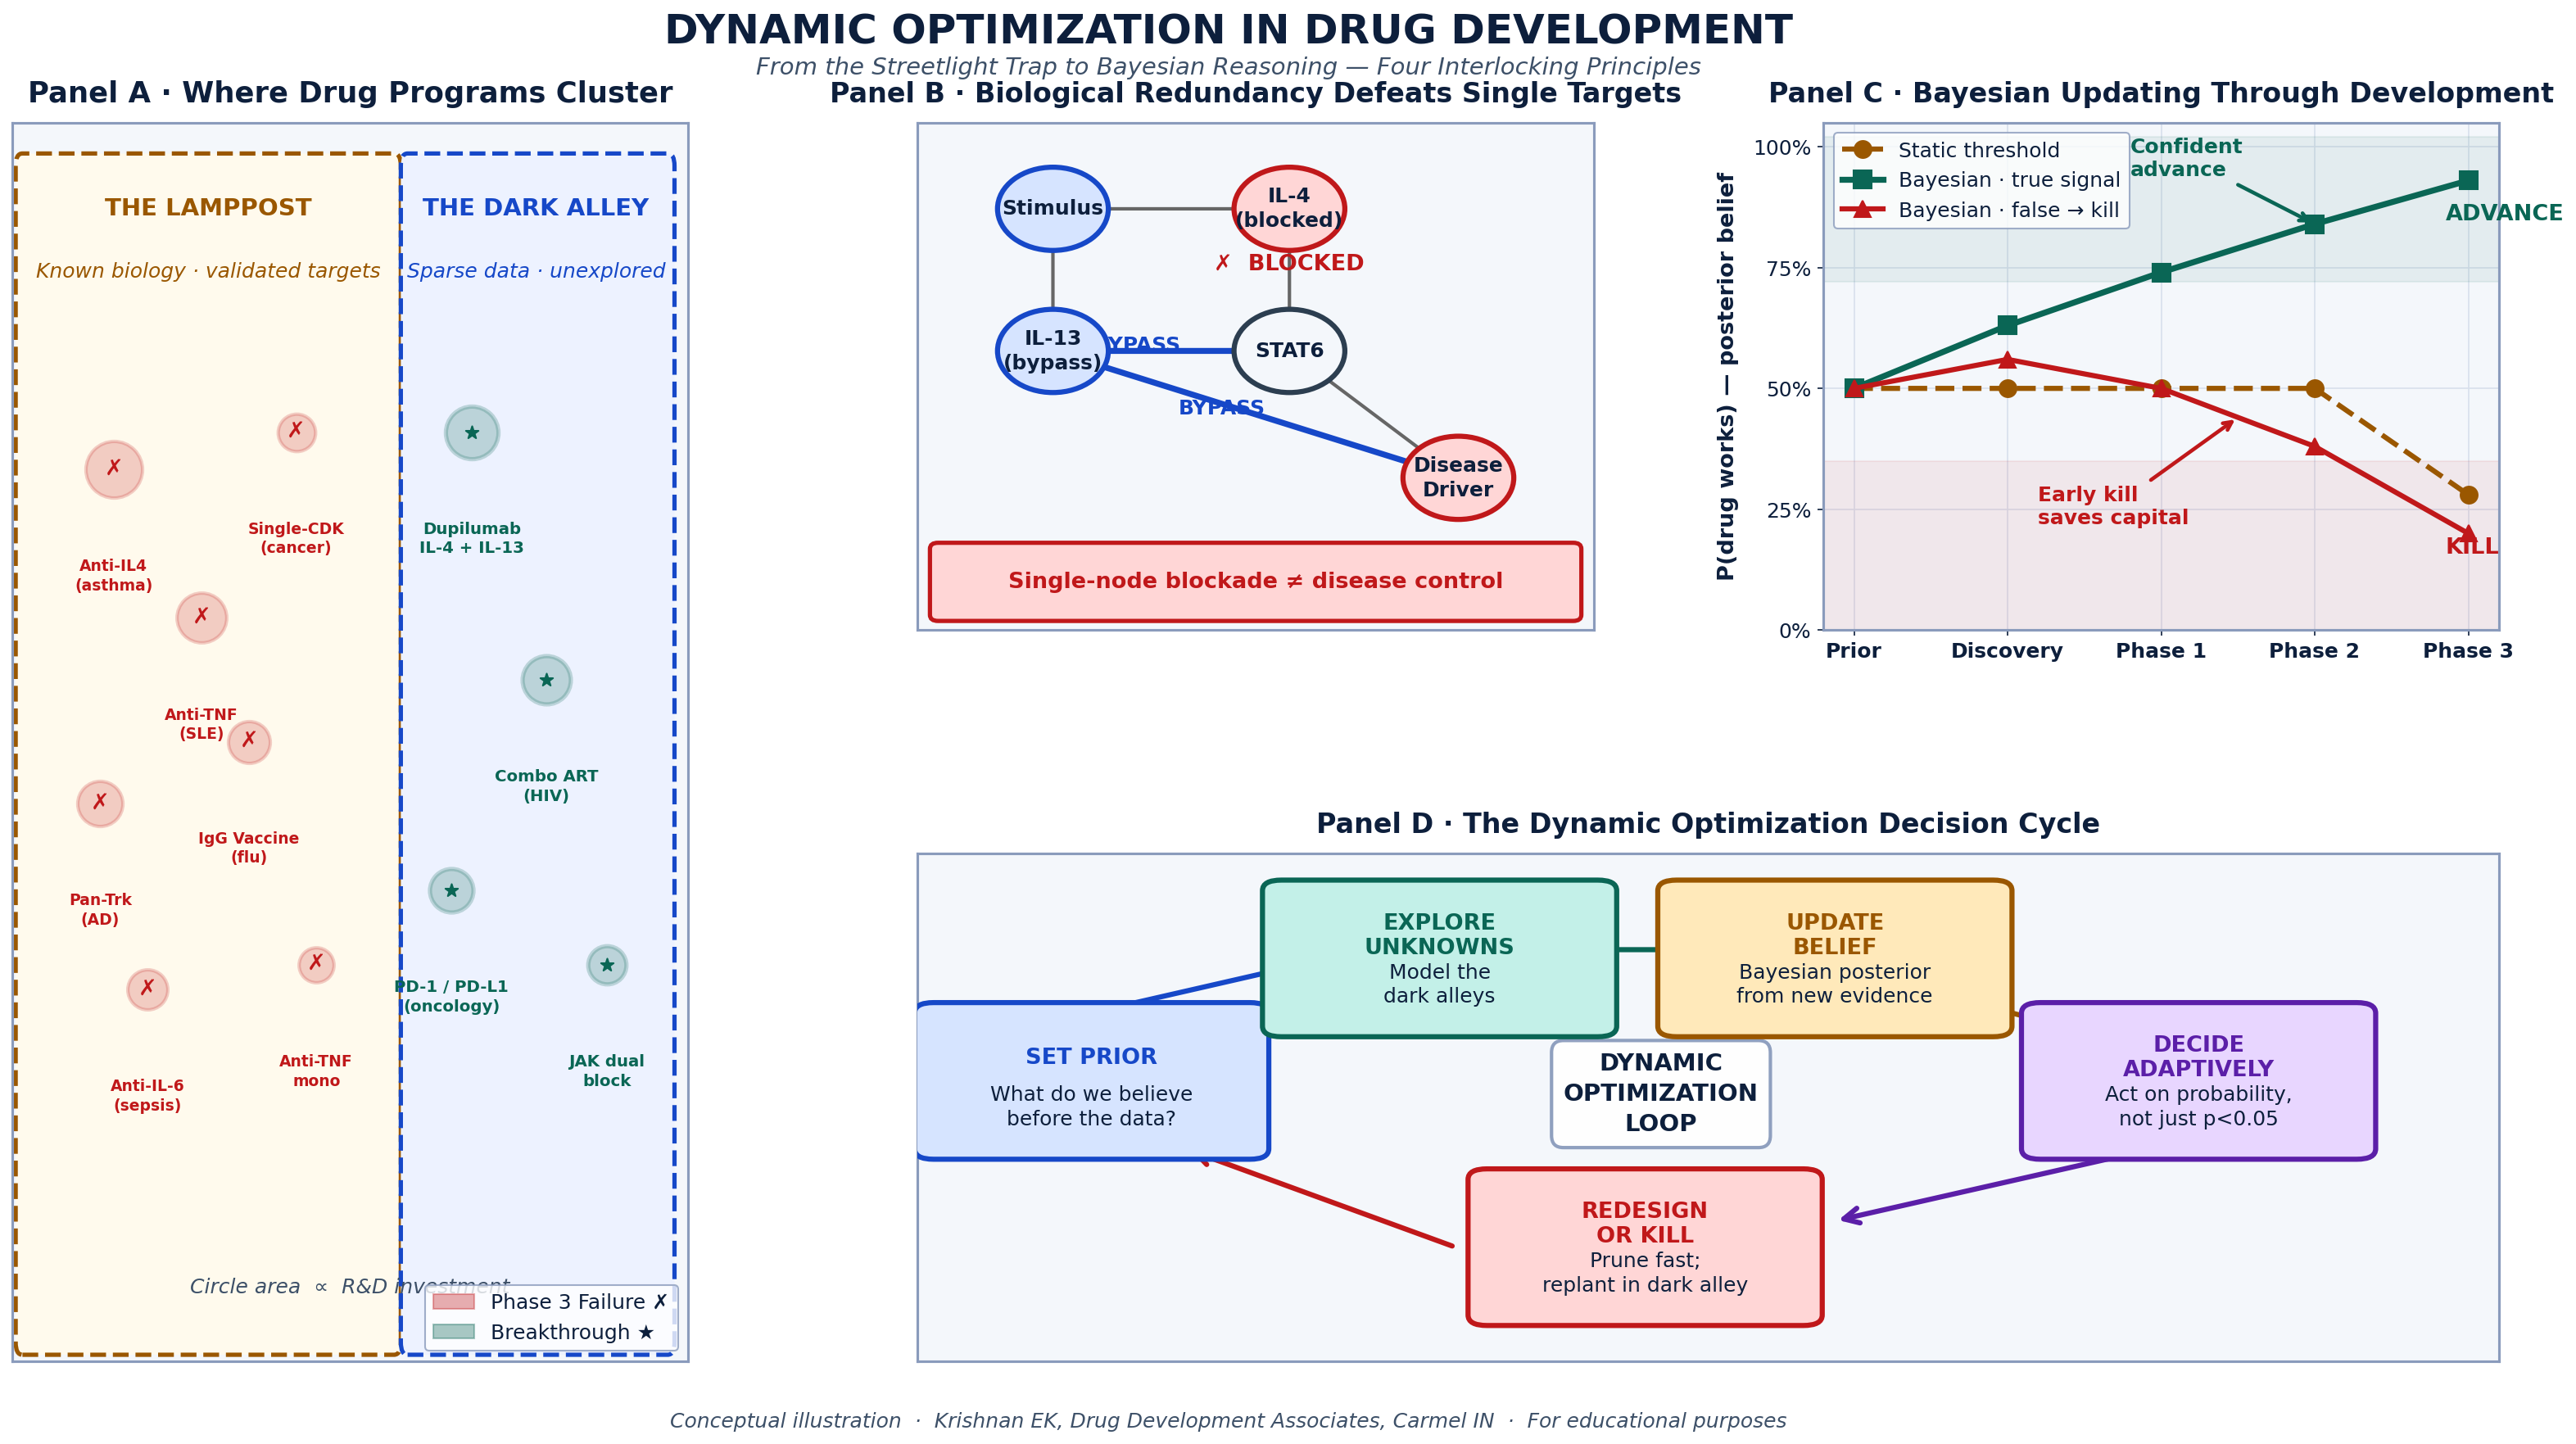
The four principles of dynamic optimization applied to site portfolio management. Panel A: Where trial risk actually concentrates (early activation window vs. mid-enrollment). Panel B: How redundant failure modes defeat single-metric monitoring. Panel C: Bayesian belief updating across the site lifecycle — monthly confidence intervals rather than binary pass/fail gates.Panel D: The five-step Adaptive Operations Loop — Set Prior → Monitor Early Signals → Update Belief → Decide at Threshold → Escalate or Support.
Source: Krishnan EK Drug Development Associates. Simulation data from Phase 3 autoimmune disease program.
The broader implication: operations as a strategic function
There is a version of clinical operations that runs trials efficiently within a fixed protocol. Sites are activated, patients are enrolled, the database is locked. This function is valuable. It is not the function that late-stage drug development now requires.
A Phase 3 program in a competitive indication where patent expiry is a known constraint is not primarily a logistical challenge. It is a capital allocation problem in which every timeline decision has a financial consequence, and the clinical operations function is one of the primary levers on that timeline.
Framed that way, the question for a clinical operations leader is not “are we hitting our site activation milestones?” It is “are we making the best possible sequential decisions about our site portfolio, given the information available at each moment in the trial?” The first question produces an operations function that executes plans. The second produces an operations function that manages risk.
The difference matters enormously to sponsors — and it matters to the long-term positioning of the clinical operations profession.
Dynamic optimization is the methodology that supports the second framing. It does not require new technology, though technology can accelerate its implementation. It requires a shift in how routine operational data is interpreted, how decision criteria are specified before a trial begins, and how the clinical operations team understands its own mandate.
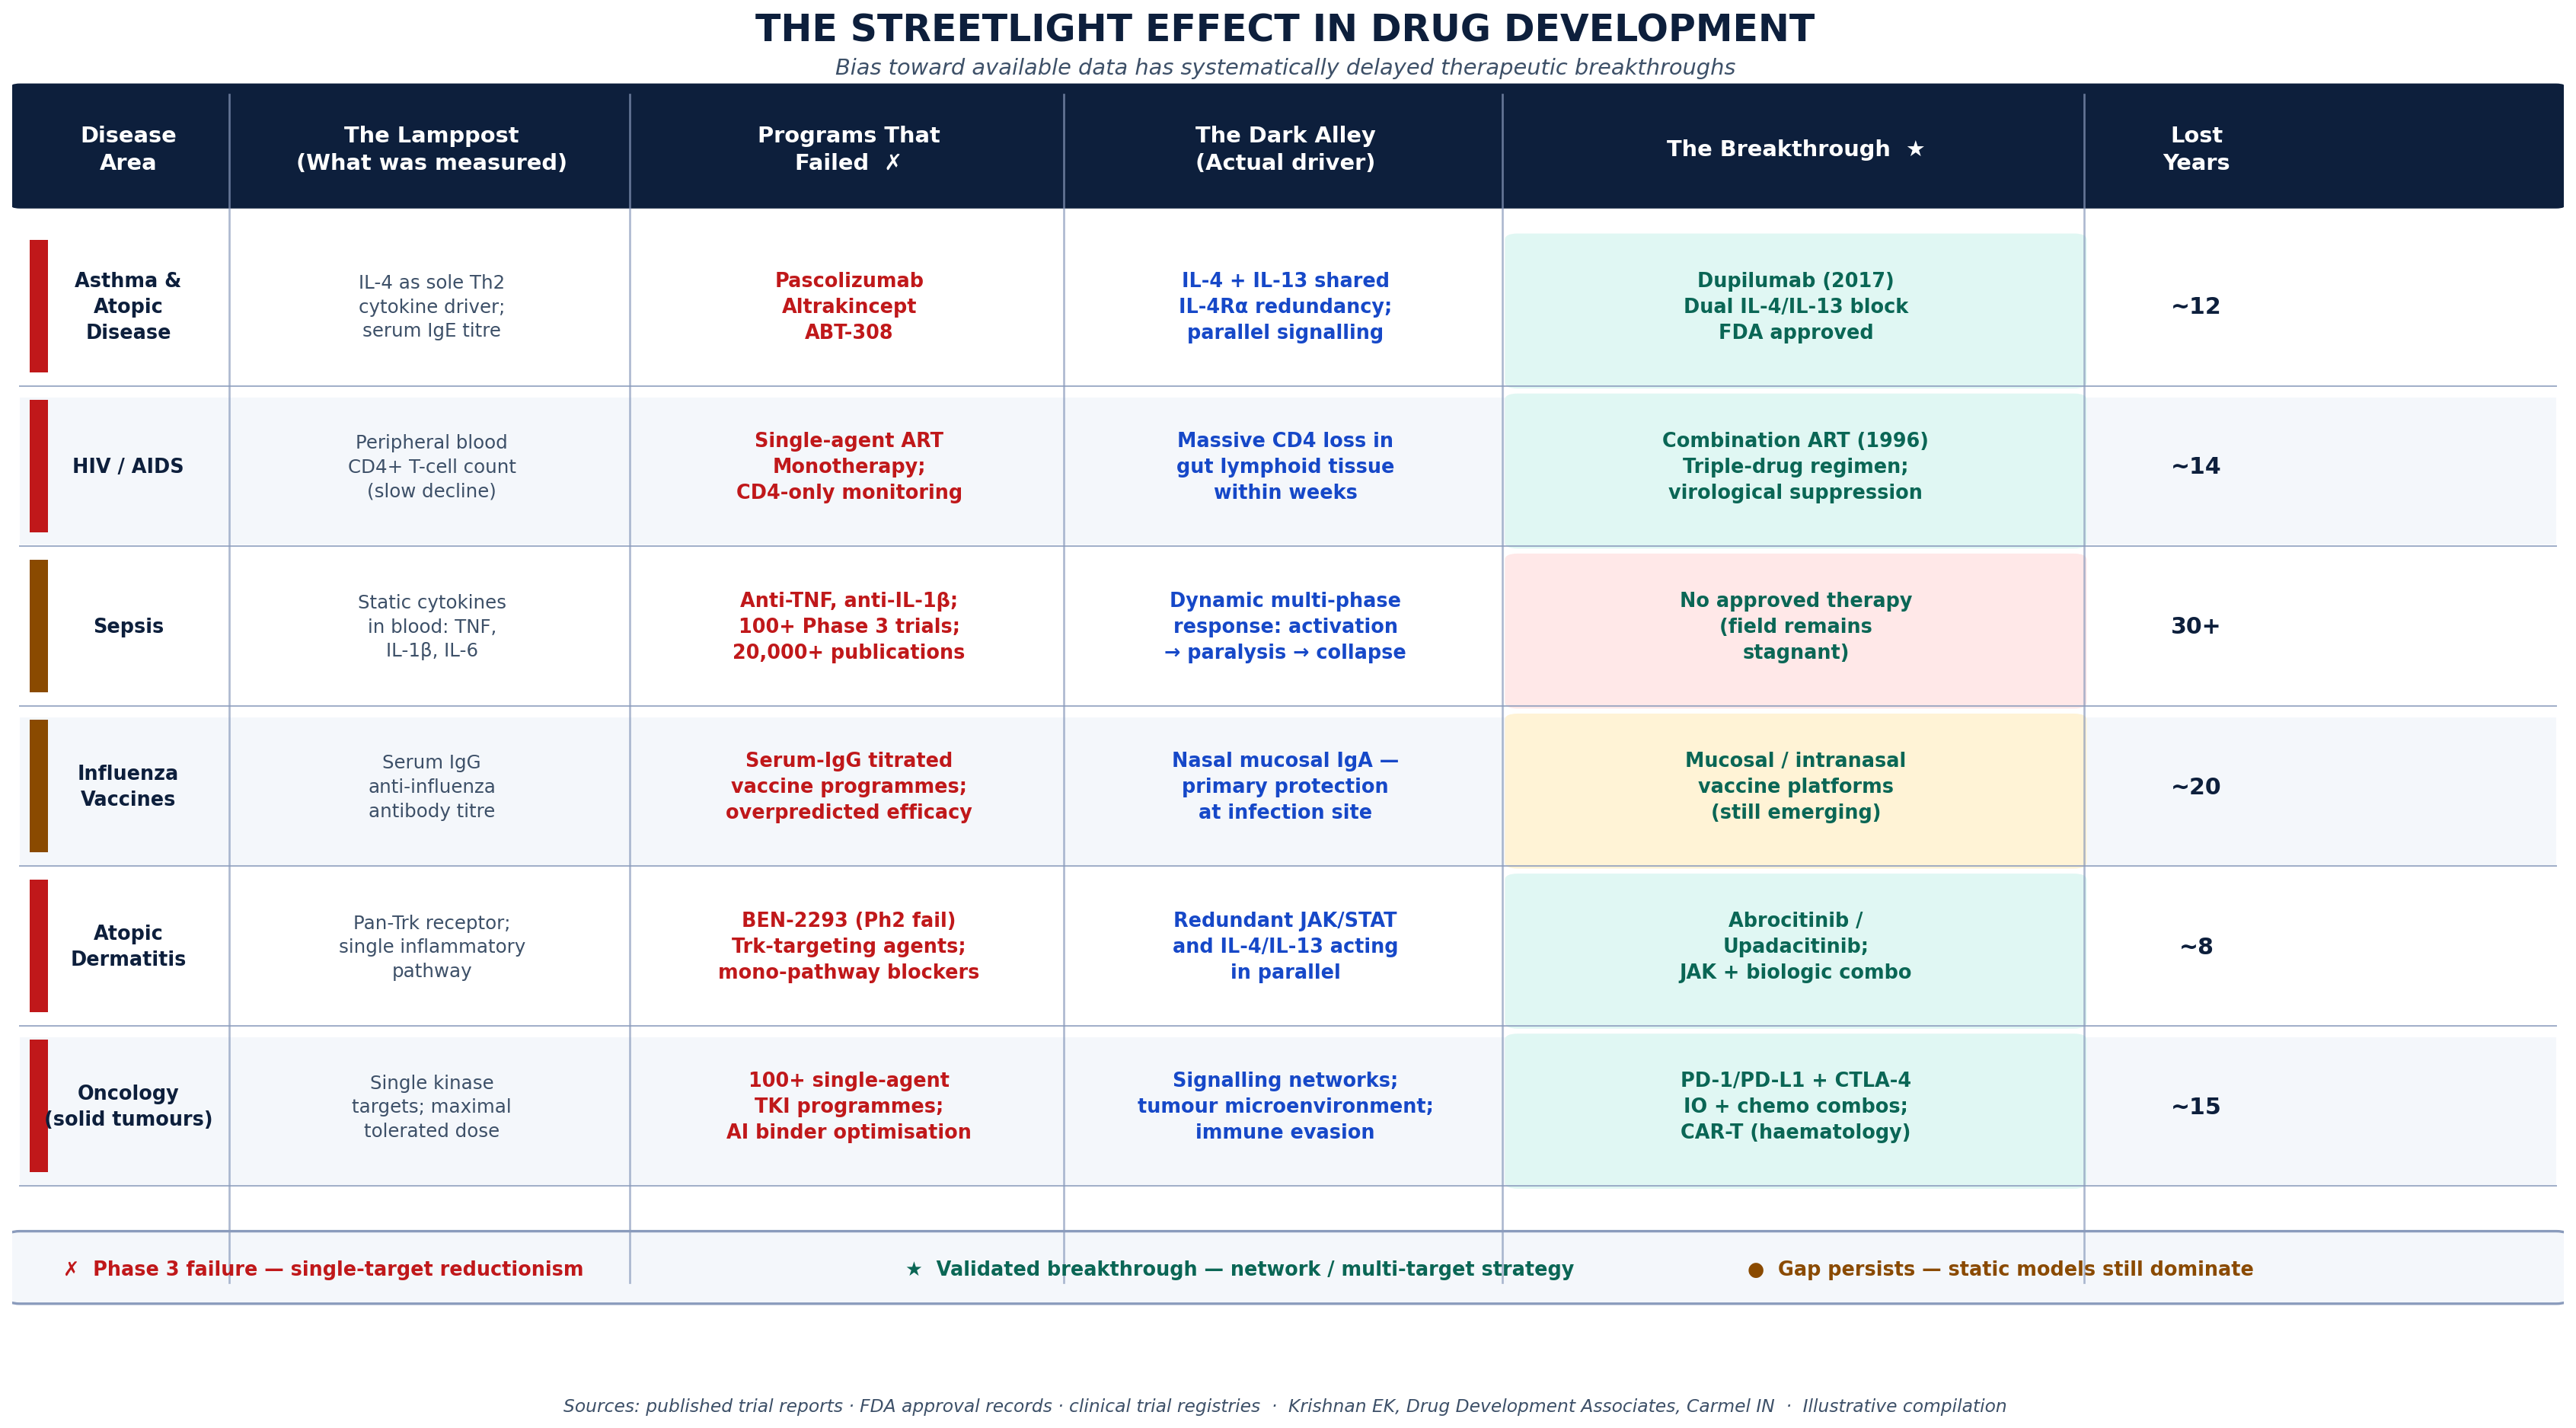
Six trial scenarios documenting the systematic cost of late operational decision-making. For each scenario: the metric being monitored (the Lamppost), what was missed (the Dark Alley), the decision that was ultimately required (the Breakthrough), and the months of timeline that were unrecoverable by the time the decision was made. Key finding: In five of six scenarios, earlier probabilistic action would have recovered 3-5 months of enrollment timeline. Estimated cumulative patent-life value lost across scenarios: $200-600M per program.
Krishnan E, Drug Development Associates. Illustrative compilation based on published trial reports and simulation data.*
A practical starting point
For clinical operations leaders who want to move toward this framework without rebuilding their entire monitoring infrastructure, a reasonable starting point is this: pick your last two or three late-stage programs and run the retrospective analysis. At what point in each trial did the eventual non-performing sites show the patterns that predicted their failure? What was the latency between when those patterns were observable and when a decision was made?
The answer, in almost every program I have reviewed, is that the signal was available three to five months before the decision. That gap is recoverable timeline. In a competitive program, it is often the difference between a label that reflects full enrollment and one that reflects what you were able to achieve under time pressure.
The analysis is not complicated. The discomfort is facing what it implies: that the next time around, you will need to act sooner, on less certainty, with a framework that makes that action defensible.
That is what dynamic optimization provides.
Eswar Krishnan, MD, M.Phil is a physician and drug development consultant based in Carmel, Indiana. He has spent 30 years at the intersection of Bayesian clinical trial methodology, adaptive operational design, and late-stage program strategy. He works with biotech and pharma sponsors on clinical operations strategy, site portfolio design, and program recovery.
*Consulting inquiries: principal@olmsted-capital.com*
*Follow for weekly posts on clinical operations, adaptive trial design, and the decisions that actually determine drug development outcomes.*